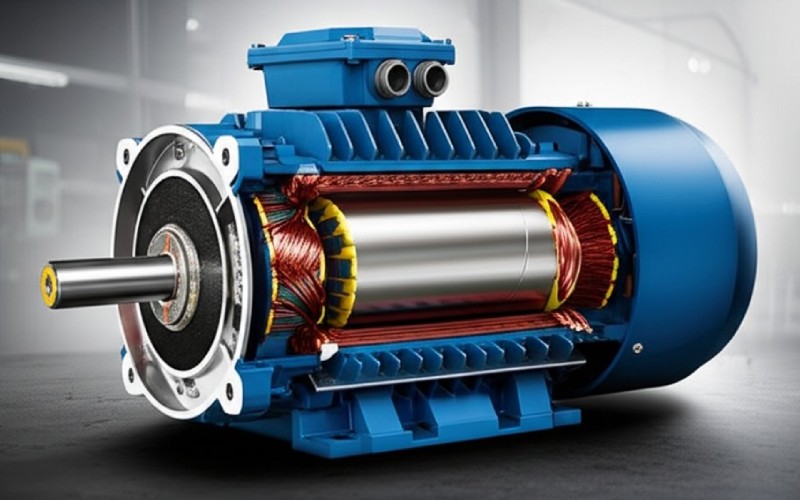
Let Sino's Lamination Stacks Empower Your Project!
To speed up your project, you can label Lamination Stacks with details such as tolerance, material, surface finish, whether or not oxidized insulation is required, quantity, and more.

If you buy CRGO lamination stacks or sign off transformer core designs, you probably spend more time than you want looking at B–H curves and “µ” tables. The basics are clear. The tricky part is turning datasheet curves into purchasing decisions and practical margins.
This guide keeps the theory short and stays close to what actually changes when you choose one lamination stack over another.
Most CRGO B–H and permeability numbers you see in lamination offers come from:
POSCO, JFE, Nippon Steel and others state exactly this in their catalogs: core loss and induction are measured after stress-relief annealing, mainly along the rolling direction, and typically quoted as W15/50 or W17/50 (loss at 1.5 T or 1.7 T, 50 Hz).
So the “smooth” B–H curve you see is:
Suitable for comparing steels. Not the same as your stacked core.
Design tools usually talk about material relative permeability µr or initial permeability. Datasheets show either:
Hi-B grades can show µ values well above 30 000 in the rolling direction.
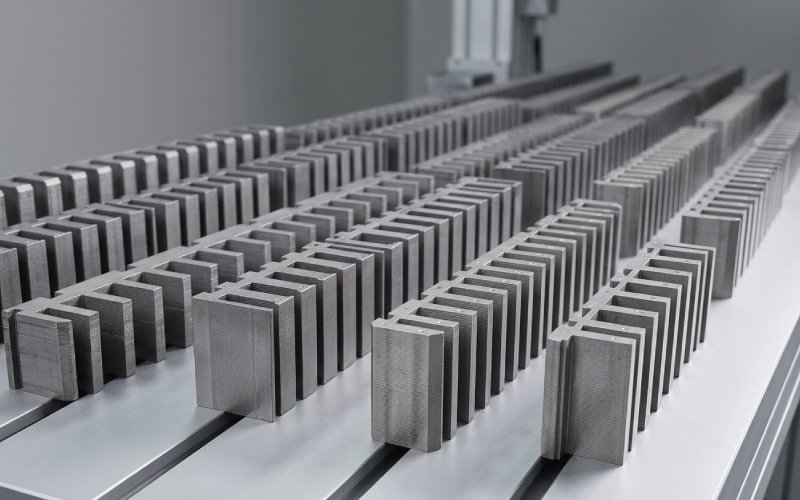
But what you actually build is a stack:
That means the effective µ of the lamination stack is always lower than the material µ. How much lower depends on:
If you compare suppliers only on catalog µ, you are comparing something you will never actually see in operation.
Engineers know the B–H curve is just B versus H with hysteresis. The question here is: which parts of that curve should drive your lamination purchase?
Use this as a quick reading order.
If one supplier quotes W15/50 and another W17/50, or mixes 50 Hz and 60 Hz, you cannot compare their curves directly. Decide on one reference condition (often 1.5 T, 50 Hz for distribution transformers) and ask everyone to supply data for that point.
Also check:
Without this, the prettiest B–H plot tells you very little.
Most modern Hi-B CRGO grades operate around 1.7–1.9 T in the rolling direction, with core losses around 0.7–1.0 W/kg at 1.5 T, 50 Hz for thinner gauges (0.23–0.27 mm).
Your design might be at:
When you look at a B–H curve:
If your operating B sits on the very steep part of the curve, you are betting on tight manufacturing control. Some projects can accept that bet. Many utility specs cannot.
The area inside the B–H loop ties directly to hysteresis loss. Larger area, higher core loss at the same B and frequency.
Two steels can have similar µ at 1.7 T but very different loop shapes:
When you only see µ or a few loss numbers, ask the supplier for:
It is the shape that tells you about behavior during inrush, over-excitation and off-frequency operation, not one permeability figure.
Here is a compact way to read the common numbers buyers and engineers debate over.
| Datasheet field | Typical Hi-B CRGO range* | What it really means in a lamination stack | How purchasing should read it |
|---|---|---|---|
| Thickness | 0.23–0.30 mm | Thinner = lower eddy loss but more sheets and more cutting effort | Price jump from 0.30 to 0.23 mm is not only material; check punching capacity and scrap policy |
| Bmax (rolling direction) | 1.7–1.9 T at rated voltage | Sets physical core size for a given kVA; higher B shrinks the core but tightens margins | Ask where the mill expects you to operate: “design B” as a band, not one number |
| Core loss P1.5/50 | ~0.7–1.2 W/kg for modern Hi-B grades | Your stack will be worse due to joints, burrs, and stress; add 10–20 % as a sanity check | Use the same test condition across vendors; treat unusually low numbers with skepticism and ask for test reports |
| Relative permeability µr at 1.7 T | Often quoted >30 000 in rolling direction | Effective µ of the stack may be 60–80 % of this once gaps and coatings are included | Use µ to screen out clearly inferior material; rely on stack testing to finalize supplier |
| Magnetizing current at rated B (typical) | Single-phase: often 0.3–0.7 % of rated current for good designs | Sensitive to both steel quality and lamination finish / assembly | Treat big spreads between vendors as a process warning, not just a material difference |
| Stacking factor | 95–97 % for good CRGO stacks | The rest is air and coating; poor stacking factor inflates effective path length and losses | Include a minimum stacking factor in the RFQ, not just the steel grade |
*Ranges are indicative only and must be checked against the actual mill datasheet and your own design rules.
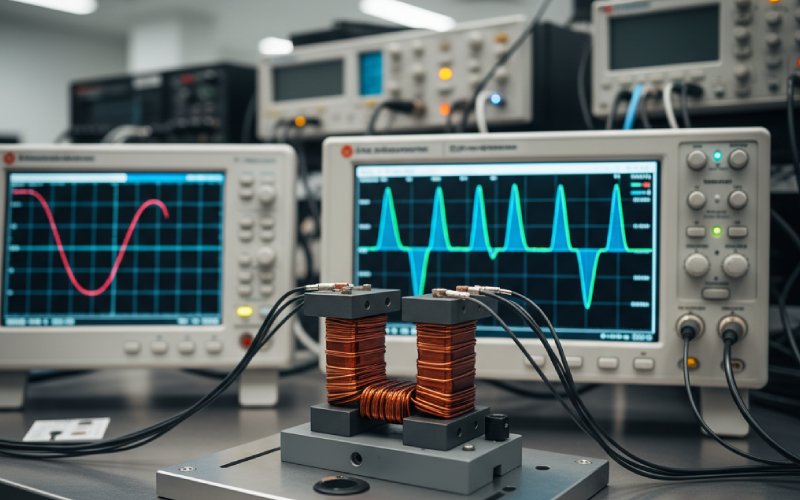
Even with the same steel, your measured magnetizing current or core loss will drift away from the “official” B–H curves. Main reasons:
If you never see vendor test reports on actual lamination stacks, only on bare steel, you are missing the most important part.
You do not need a complex routine. A short checklist that both engineering and purchasing can use is usually enough.
This removes half the confusion.
Purchasing does not need to do the math; they just need a simple “OK / tight / risky” tag from the design team.
Instead of only P1.5/50, ask for loss versus B up to your maximum flux. Then, for each candidate steel:
Sometimes a steel with slightly higher datasheet loss at 1.5 T behaves better in the 1.6–1.7 T band where your core actually runs.
For at least one reference core size, ask the lamination supplier to provide:
This tells you more about their punching, deburring and assembly than any isolated B–H curve.
Once you choose a vendor, capture in your internal spec:
Then the purchasing team can run future RFQs against this spec without re-doing the magnetic homework each time.
Grade labels like “M3” or “M5” have general meaning, but each mill has its own chemistry, texture control and thickness tolerance. Standards such as IS 3024 or EN 10107 define loss limits; mills then compete by going below those limits with their own process.
Only if the test conditions match. µ measured at 5000 A/m is not the same as µ inferred around 1.5 T. Always check:
Test standard (IEC 60404-2, JIS, ASTM)
H or B level where µ is calculated
Whether the sample was stress-relief annealed
If any of these differ, use the numbers as rough screening only.
Not necessarily. Differences of 10–20 % between Epstein test and finished core are common once joints, stress and stacking factor are included. If the gap is larger, check:
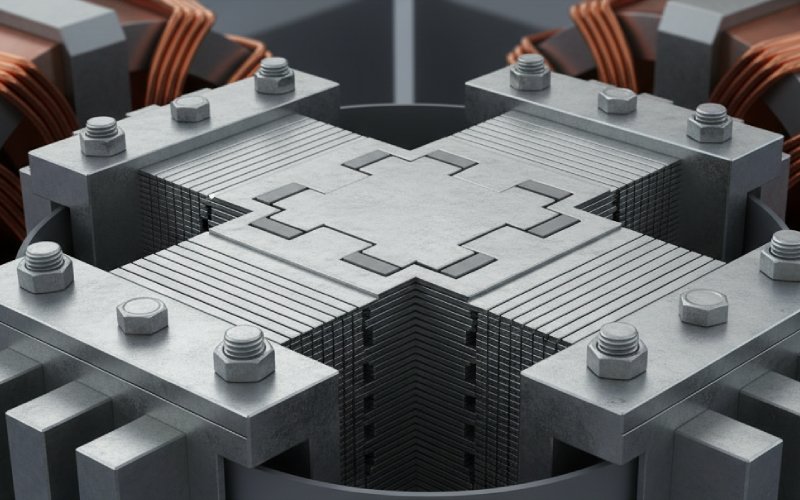
Burr height and deburring practice
Whether the assembly followed the intended step-lap pattern
Whether the stack went through correct stress-relief annealing
Not always. A slightly higher loss grade that is stable and widely available can be a safer choice than a niche low-loss grade with long lead times. Also consider:
Cost of extra copper and tank size if you choose a lower-grade steel
Stocking strategy and availability from multiple mills
Your typical operating point; if your cores run at 1.5 T, a steel optimized for 1.8–1.9 T might not pay back its cost
Technically possible, but it complicates prediction of magnetizing current and local heating. Mixing grades in yokes versus limbs shifts flux distribution and makes B–H behavior less predictable, especially during inrush. If you must mix, do it in a controlled, documented way and re-test losses on a full prototype.
Yes. Eddy current loss scales with thickness squared, so going from 0.30 mm to 0.23 mm can cut eddy loss significantly at the same B and frequency. If your design runs at higher frequency, thickness often matters more than small differences in µ between similar grades.
At minimum:
Steel grade and thickness
Target P1.5/50 (and P1.7/50 if relevant)
B–H curve up to your maximum B, with test standard stated
Minimum stacking factor and maximum burr height
Step-lap pattern and tolerance on overlap
Requirement for stack-level no-load loss and magnetizing current on a reference core
With that data in the RFQ, both engineers and buyers can read the same B–H curve and reach the same decision, without guessing what is hidden behind a single permeability number.