Let Sino's Lamination Stacks Empower Your Project!
To speed up your project, you can label Lamination Stacks with details such as tolerance, material, surface finish, whether or not oxidized insulation is required, quantity, and more.
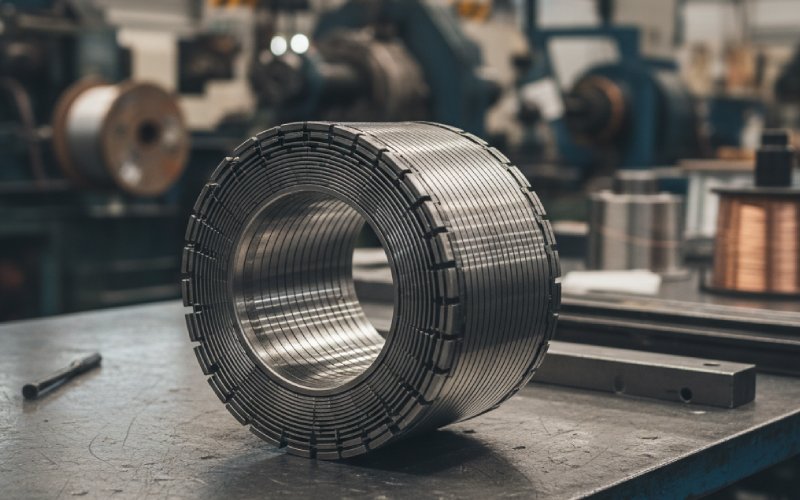
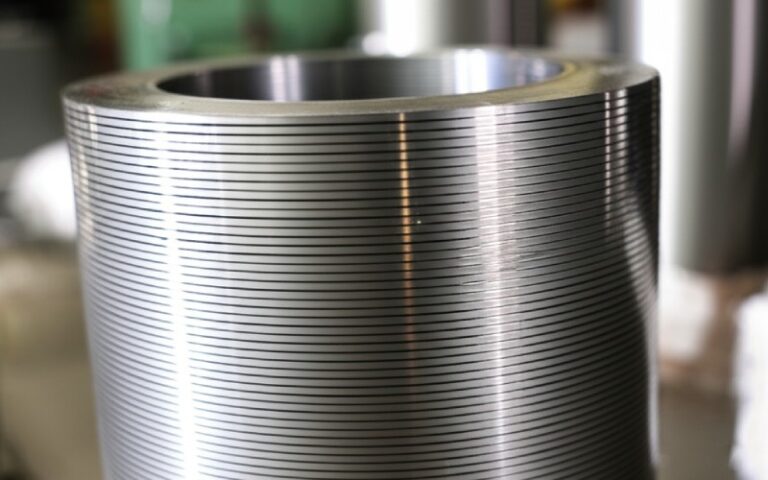
Stacking factor is the quiet ratio that says how much of your stator or rotor stack is actually magnetic steel and how much is coating, glue, and trapped air. It sounds minor, but it directly caps the flux you can run, the losses you can tolerate, and therefore the power you can extract from a given outer diameter and length. Get it wrong and you lose several percent of power density without changing a single winding turn.
Formally, stacking factor (also called lamination factor or space factor) is the ratio between the effective cross-section of magnetic material and the total geometric cross-section of the laminated core
If you prefer it written in symbols, one common expression is
kst = Airon / Agross = liron / (liron + lair)
where the denominator includes not only air but also coating and adhesive layers along the stack length.
Because insulation and gaps never carry useful flux, kst is always below 1. Typical electrical-steel stacks for machines and transformers fall between about 0.90 and 0.98 depending on lamination thickness, coating type, and how aggressively the stack is compressed. Amorphous cores sit a bit lower, around 0.8, which designers already know shows up as higher flux density for the same apparent core area.
So the number itself is simple. The interesting part is what it quietly does to power density when you move from ideal drawings to actual steel.
Start with a fixed outer stator diameter, fixed axial length, and a given voltage–speed point. You already know that sets the required air-gap flux per pole if you want a particular back-EMF at your base speed. That flux has to cross your stator and rotor cores, which means a certain average flux density in the laminations.
But the flux density in the steel is not based on geometric cross-section; it is based on the effective steel area. If your CAD model assumes solid steel, you implicitly assume kst = 1. Reality usually gives you 0.95, 0.96, maybe less. So for the same flux, actual (B) in the steel is scaled up by roughly 1/kst.
Now link that to power density. At a given current loading, torque scales roughly with flux per pole and active volume. Reduce the usable steel area (lower stacking factor) while keeping the geometric volume and electrical loading fixed, and you push the steel closer to saturation and increase core losses. At some point you have to back off flux or current or both to keep efficiency and temperature under control. That backing off is exactly where you give away power density.
Core loss is highly nonlinear with flux density. Many steels end up around a B^2 to B^2.5 law at the frequencies we care about. So a modest increase in (B) from a slightly worse stacking factor can mean a noticeably larger jump in iron loss. Once you’re designing motors in the 5–20 kW/L range, that jump is something you can’t quietly ignore.
Take a very ordinary example. Say you design a motor assuming:
So the design assumption is
B1 = Φ / (k1 * Agross) = 1.6 T, k1 = 0.96
Now production reality gives you a measured stacking factor of 0.92 because the lamination coating is a bit thicker, there is some waviness, and the bonding process adds glue where you did not plan for it.
The same flux through less effective steel area means
B2 = Φ / (k2 * Agross) = B1 * (k1 / k2) = 1.6 * (0.96 / 0.92) ~= 1.67 T
That is only about a 4.3% increase in flux density. Not dramatic at first glance. But if core loss scales approximately with B^2 to B^2.5, you are looking at roughly 9–11% extra iron losses in the stator at the same operating point.
If you instead choose to keep losses where you originally wanted them, you have to reduce Φ by the same factor, ending up with about 4% less flux per pole. That directly trims torque and continuous power for the same frame size. Power density drops by roughly the same few percent.
To make this less abstract, here is a compact comparison. Numbers are approximate, but the ratios are what matter.
| Case | Assumed stacking factor kst | Effective steel area (normalized) | Average flux density in steel for same Φ | Relative iron loss (assuming Pfe ~ B^2) | Relative continuous power (if you hold losses fixed) |
|---|---|---|---|---|---|
| Design expectation | 0.96 | 0.96 | 1.60 T | 1.00 | 1.00 |
| As-built reality | 0.92 | 0.92 | 1.67 T | ≈1.09 | ≈0.96 |
A 4% drop in continuous power from the same frame and cooling system is not a lab curiosity; at EV or traction power densities, that is another few kilograms of motor or additional thermal margin you did not intend to spend.
In the documentation world, stacking factor is a neat scalar you plug into the equations. In the shop, it is the end result of several messy details.
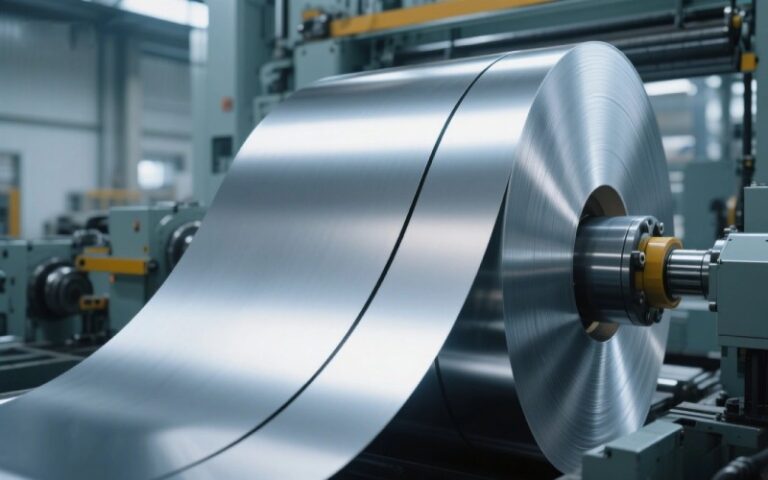
Lamination thickness and coating type are first in line. Thinner gauges reduce eddy losses but need insulation coatings that are non-negligible as a fraction of the thickness, which tends to lower stacking factor relative to thick laminations with proportionally thinner coatings. That is the usual trade-off: you win on dynamic loss and sometimes give back a portion of cross-section.
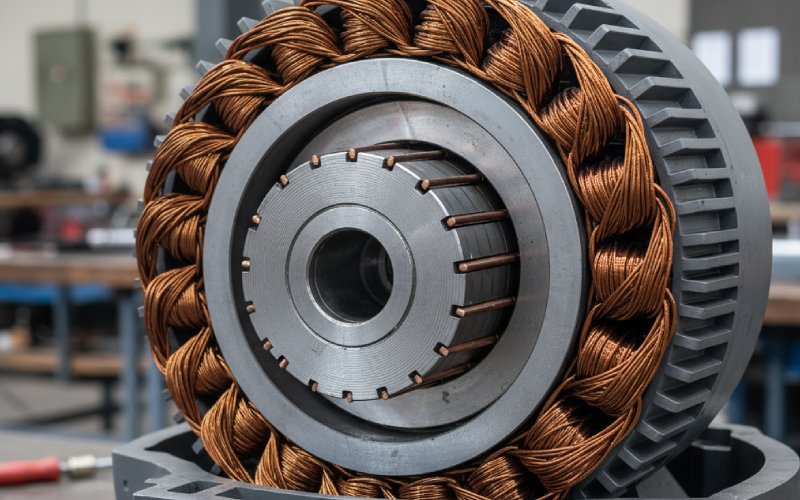
Assembly method matters just as much. Interlocking teeth, welding, cleating, bonding with backlack or glue, and even simple press-stacking all lead to slightly different void patterns and gaps between sheets. Industrial notes on new-energy motor cores explicitly warn that excess adhesive can reduce stacking factor and degrade motor performance.
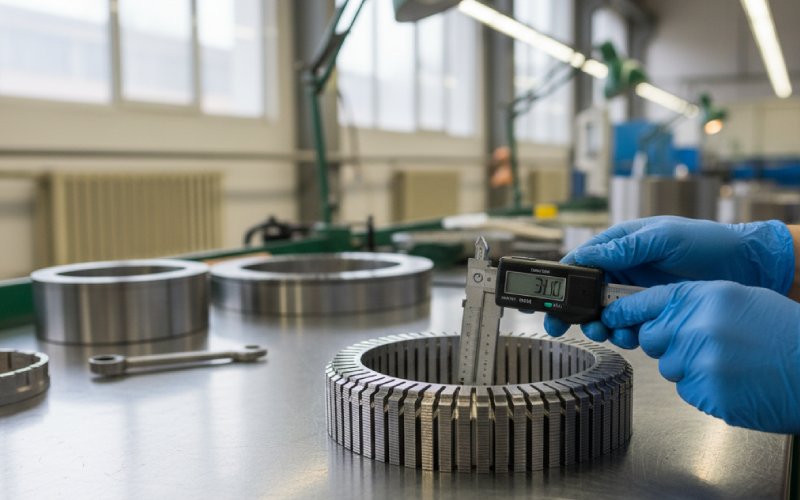
Then there is pressure. Most standards define stacking factor under a specified compressive load, precisely because gaps shrink under force. Your supplier’s “0.97” might be measured on a carefully compressed coupon that looks nothing like the actual stator core after welding and machining.
The result: you might design to 0.97, purchase steel qualified at 0.97, but ship motors closer to 0.94. No model crash, just quiet drift.
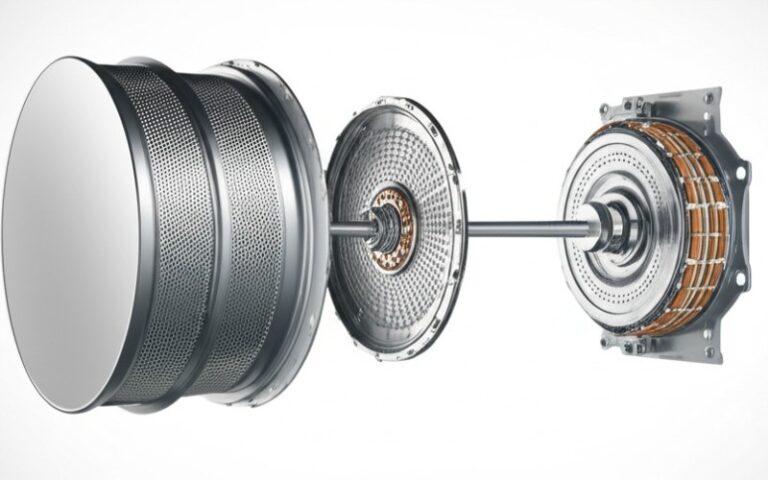
High power density is usually framed as high electrical loading, high magnetic loading, and aggressive cooling. Stacking factor sits upstream of the magnetic-loading part. It decides how much steel you really have to work with.
From a pure flux point of view, the link is direct. For a given frame (outer dimensions fixed),
B ~ 1/kst
for a fixed voltage–speed target. If you specify a realistic range for stacking factor rather than a single number, the corresponding range for (B) at nominal operation falls right out. That range feeds straight into loss predictions and temperature margins.
On the manufacturing side, higher stacking factor (closer to 1) reduces flux crowding and associated loss density for a given power level. Sources from transformer and motor production report that improved stacking factor leads to better magnetic uniformity and lower core loss, which designers then cash in as either higher efficiency or higher continuous power for the same volume.
The key point is simple: every 1–2% of stacking factor that you leave on the table is roughly 1–2% of continuous power density you cannot access without raising losses or temperature. The relationship is not perfectly linear, but at the system level it behaves that way often enough to matter.
Most FEA tools for electromagnetic design ask for a stacking factor per region when you assign a laminated material. Typical guidance suggests values above 0.95 for well-made stacks, with warnings if you input values below about 0.5 because that would mean more void than steel.
If you feed the solver an optimistic value, flux density and losses come out lower than they will be in the actual motor. If you then use those results to size cooling, you will end up running hotter in production.
A pattern that works better is to model two or three stacking-factor cases for the same design: an optimistic value close to the material spec, a realistic “production” value informed by the stacking method and supplier data, and a pessimistic case representing worst-case assembly. The spread in predicted power density and losses across those cases is essentially the cost of uncertainty in stacking factor. Treat it as such.
Recent EV motor design studies point out that optimizing lamination stack solutions, including achievable stacking factors, directly contributes to lower power losses and higher power density in electrified vehicle motors. Nothing exotic. Just careful treatment of how much steel is actually in the path of the flux.
There is a catch: chasing a higher stacking factor is not free. You can increase stack pressure, reduce glue, choose thinner coatings, or change stacking method, but each of those knobs touches something else in the design.
Higher pressure or more rigid interlocking can change mechanical stress distribution and acoustic behavior of the stator. Some joining methods with very good stacking factor may introduce local hot spots, distortion of tooth tips, or additional machining steps.
Bonded stacks, especially with backlack laminations, tend to have slightly lower stacking factor than a tightly pressed and welded stack. But they offer better mechanical damping, reduced vibration, and simpler automated assembly. Many traction motors accept a few tenths of a percent reduction in stacking factor for the gains in noise behavior and manufacturability. The power-density “loss” is partly offset by what you can then do on cooling and speed.
So you do not blindly maximize stacking factor. You decide how much you are willing to trade. The important part is to keep that trade explicit and quantified, not buried inside an optimistic single number in a spreadsheet.
One useful habit is to specify stacking factor as a range on your motor drawings instead of a single value. For example, “0.95–0.97 under X kPa compressive load, measured per ASTM method Y.” That gives manufacturing and suppliers something concrete to work toward while reminding everyone that 0.97 is not guaranteed.
Another habit is to keep your electromagnetic sizing formulas tied to effective dimensions instead of nominal ones. When you use Carter’s coefficient and stack factors in analytic models, keep track explicitly of which lengths and areas are effective and which are geometric. It is a minor bookkeeping task that avoids quietly assuming 100% steel where only 95% exists.
And a small but important point: when you compare motors on a “kW per liter” basis, make sure you are not comparing a design benchmark built with an optimistic stacking factor assumption against your own simulation that uses pessimistic values. Otherwise you are comparing geometry and process assumptions all at once and learning very little.
Stacking factor is not a glamorous design variable. It is a single number between 0 and 1 that mostly appears as a multiplier in your equations and in the material setup dialog of your FEA tool. But it defines how much of your machine’s active volume actually participates in carrying flux.
For a given frame size, it sets whether you get a full measure of magnetic cross-section or quietly lose a few percent of steel to coatings, voids, and assembly details. That difference feeds directly into flux density, core losses, and the real continuous power density you can claim without running out of thermal or efficiency margin.
Treat stacking factor as part of the power-density budget, not as a vague correction term. Get realistic numbers from your lamination supplier, tie them into analysis as ranges rather than single values, and decide consciously how much power density you are willing to trade for manufacturability and acoustic behavior. That is usually enough to stay ahead of competitors who still assume their laminations behave exactly like the textbook solid blocks of steel they never were.