Laissez les piles de pelliculage de Sino renforcer votre projet !
Pour accélérer votre projet, vous pouvez étiqueter les piles de laminage avec des détails tels que tolérance, matériel, finition de la surface, la nécessité ou non d'une isolation oxydée, quantitéet bien d'autres choses encore.
Noise and Vibration Testing Related to Lamination Quality: What to Measure
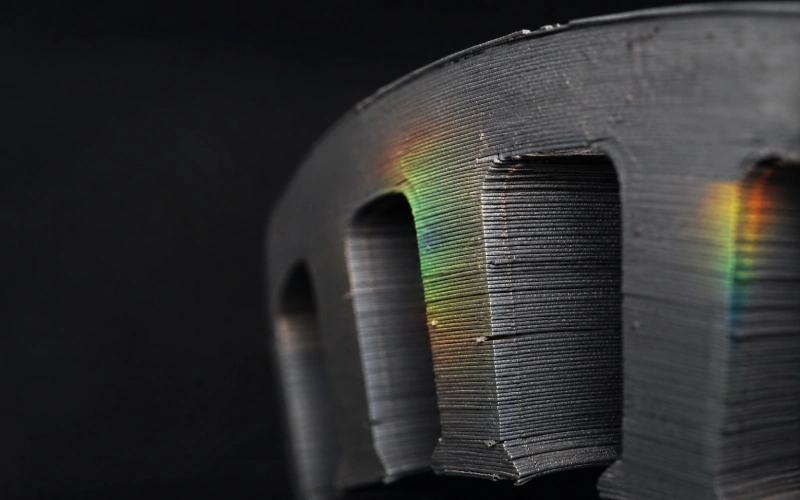
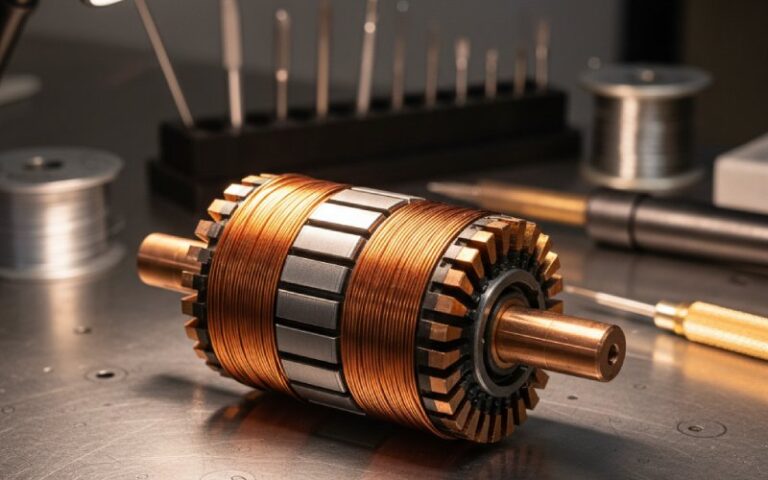
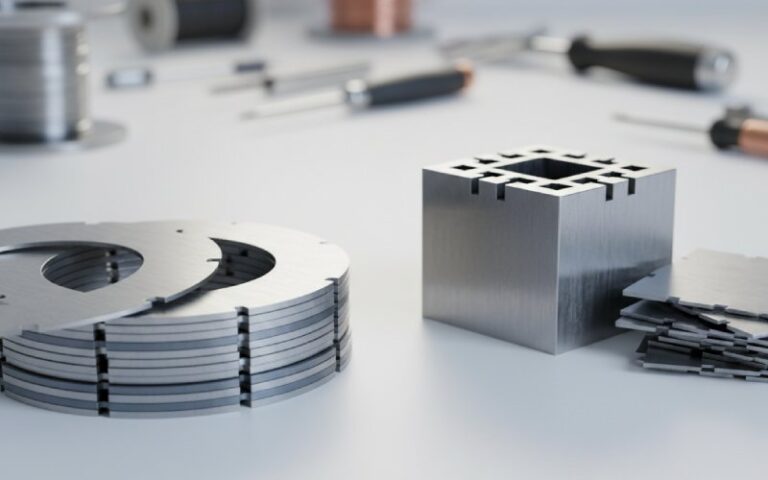
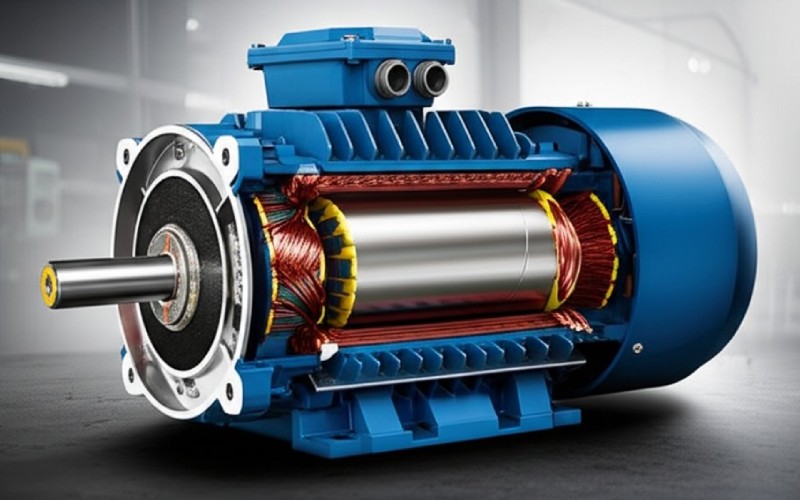
A stack of stamped steel sheets looks like the least acoustically interesting part of a machine. It isn’t. By the time a motor whines on a test bench or a transformer hums louder than its spec sheet allows, the trail often leads back to how those sheets were cut, stacked, joined, and clamped. When a platform misses its noise targets, the root cause frequently sits inside the rotor and piles de laminage de stator — and by the time it appears on the bench, fixing it means redesigns, new tooling, and lost months.
So the question isn’t whether to test. It’s what, exactly, to put a sensor on.
This is a working list. Some of it is bare-stack work you can do before anything is wound. Some only shows up under excitation.
Table des matières
The stack is a structural component that happens to be magnetic
Two properties matter for acoustics, and lamination quality moves both.
Stiffness. A stack is stiff in-plane and much softer through-thickness. That anisotropy is not a fixed number — it depends on clamping. Modeling the behavior of stacked steel plates is genuinely difficult, which is why experiments at several preload levels on unmodified stacks are worth doing rather than assuming datasheet values. One finding worth keeping in mind before you trust any single modulus figure: stiffness values from static and dynamic measurements diverge significantly, and using dynamically obtained values in static models — or the reverse — introduces error.
Damping. This is the part most programs under-measure. Structural damping sets the amplitude of resonance, and it’s a key factor in predicting electromagnetic vibration. It also remains comparatively underexplored, and the anisotropic material damping of cores and windings less so still. Meanwhile the laminated structure makes damping anisotropic, and the lamination effect noticeably raises anti-phase modal damping ratios while doing little to in-phase ones.
Which leads to a result that surprises people: the choice between adhesive bonding and welding has been shown experimentally to have little impact on in-phase and anti-phase modal damping ratios, and natural frequencies of interlocked/welded stators haven’t shifted much even across quite different structural designs. Yet bonding has produced acoustic noise reductions on the order of 50%. The energy path, not the modal table, is doing the work. Keep that distinction in mind when you design a test plan — modal frequencies alone will not tell you whether a joining change helped.
Three families of measurement
Split the work. It saves arguments later about what a number means.
1. Bare-stack modal testing
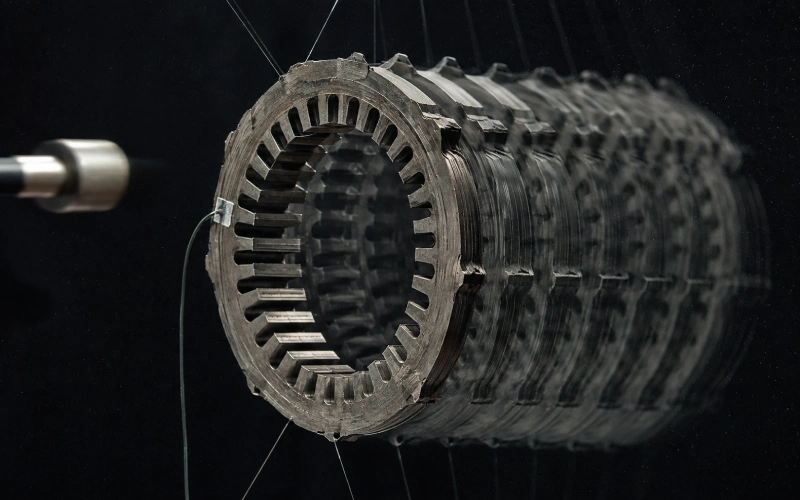
Roving or fixed impact hammer, free-free suspension, accelerometer or laser vibrometer, curve-fit the FRF.
Excite it in the directions the machine will actually be excited in. A useful pattern: strike the outer periphery of the core back radially, then measure at the tooth tip and at the core-back center 180° from the excitation point. Then repeat with axial excitation at the radial center of the core back, same measurement points. Radial-only testing misses axial and out-of-plane behavior — which is exactly where interlaminar looseness lives.
Extract:
Circumferential mode frequencies, m = 0, 2, 3, 4 (higher if the slot count demands it)
Axial bending and umbrella modes
Modal damping ratio per mode, via half-power bandwidth or SDOF fitting
Mode shape consistency across the stack height
That last one is a quality signal by itself. If mode shapes are clean at one end and smeared at the other, your clamping or bonding is not uniform along the axis.
2. Physical stack geometry and joining integrity
These are cheap measurements that predict a lot.
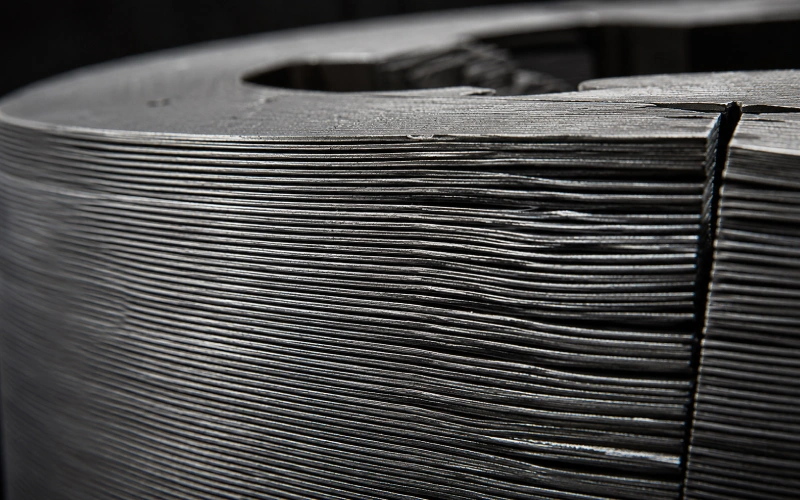
Blanked sheets are never identical; deviation accumulates over hundreds of layers, and the finished core ends up with inconsistent concentricity or perpendicularity. Space factor drops, and vibration noise appears through resonance.
A practical acceptance method for stack build accuracy: measure laminate thickness at ten locations across the width and evaluate the average deviation. Deviation below half of one sheet’s thickness is excellent; between half and one sheet thickness is acceptable; at or above one full sheet thickness, it’s a problem. That scaling — to sheet thickness rather than an absolute micron figure — travels well between products.
Bow matters too. A documented limit for outside-diameter gap caused by lamination bow is 0.18 mm. Tight, but the physics is simple: a gap is a place where sheets can move independently.
3. Excited and running measurements
Nothing at the bare-stack level captures magnetostriction or force-wave interaction.
Magnetostrictive behavior under magnetization causes noise: silicon steel expands along the magnetization direction, and under AC excitation the core repeats expansion and contraction, and those vibrations become sound. There’s a second mechanism sitting alongside it: electromagnetic vibration between stacked sheets, where sheets tend to rattle from the attractions and repulsions generated by magnetization.
The interesting failure mode is a mismatch, not a material shortfall. Cores built from sheet with excellent magnetostriction performance frequently fail to deliver low noise — and the cause is often resonance between a core natural frequency and the magnetostrictive vibration frequency. Good material, wrong modal placement. Your test plan has to check both.
On the assembled machine, use order tracking. Order tracking maps vibration or noise to harmonics of rotational speed, which lets you attribute energy to specific sources such as gear mesh or slot harmonics. A concrete example of what this catches: a 48th-order whine traced to stator slot harmonics. Run up slowly, build a Campbell diagram, and look for order lines crossing the modal frequencies you measured in step 1.
Do it in a semi-anechoic room if you can. Comparative NVH testing before and after a design change is standardly done in a semi-anechoic chamber, and the reason is boring but real: reflections will invalidate your amplitude comparison.
What to measure, how, and what a bad number means
Measurand
Méthode
Stage
Interpretation of a bad result
Circumferential mode frequencies (m=0,2,3,4)
Impact hammer FRF, free-free
Bare stack; repeat after winding
Shift vs. baseline = stiffness change from joining, clamping, or geometry drift
Modal damping ratio
Half-power bandwidth or SDOF FRF fit
Bare stack and wound assembly
Low damping raises resonance peaks; scatter between units points to inconsistent bonding coverage
Anisotropic moduli (in-plane E, through-thickness E, shear G)
Dynamic and quasi-static tests at stepped preload
Material/process qualification
Values drifting with preload indicate under-clamped or non-uniform stacks
Deviation ≥ one sheet thickness signals tooling wear or feed variation
Bow / OD gap
Gauge or optical profile at rim
Post-stack
Gap = independent sheet motion under magnetic force
Concentricity, perpendicularity
CMM or optical
Post-stack
Accumulated blanking deviation; drives eccentric air gap
Interlaminar buzz
Axial-axis accelerometer under AC excitation; airborne mic close-field
Excited core
Broadband or high-frequency content that shifts with clamping = looseness
Magnetostrictive vibration
Sheet-level or ring-sample displacement under controlled B
Material selection
Establishes the excitation floor before structure is involved
Order content vs. speed
Order tracking, run-up, semi-anechoic
Complete machine
Order line coincident with a measured mode = resonance, not a source problem
Sideband / non-integer content
High-resolution spectrum
Complete machine
Eccentricity or asymmetric clamping
Preload: the measurement people skip
Looseness is the most common lamination-related NVH defect and the least well quantified.
When laminations go loose, they vibrate, and that vibration can damage both lamination and winding insulation. The traditional check is crude: try to slide a knife blade between adjacent laminations, and if it fits, conclude stack pressure is insufficient. Pressures below roughly 250–350 psi typically fail that test. The limits are obvious — it’s qualitative, pass-fail, imprecise, and it can damage the insulation you’re trying to protect.
Better: instrument it. Track height under a defined axial force, log press force during stacking, and correlate both against a vibration signature under AC excitation. Then you have a number you can trend.
There’s also a magnetic reason to care about tight stacking. Higher lamination factor is among the core parameters associated with reduced noise. Air between sheets is not neutral.
Joining method changes what you should look for
Different processes fail differently, so the acceptance criteria should differ too.
Méthode
Acoustic behavior
What to watch in test
Interlock (progressive die)
Good when executed well; loose or poorly interlocked stacks are the most prone to lamination buzz
Axial vibration under excitation; local looseness away from interlock points
Weld
Stiff, but can transmit vibration; localized loss near welds unless carefully optimized
Mode shape asymmetry around weld cords; heat-affected zone effects
Adhesive bond
Best damping of the common options, though experimental modal analysis of bonded stacks still shows a relatively lightly damped system
Damping factor and loss factor increased 1.9× and 1.7× after annealing, with stiffness reduced by the same factors; a 27% rise in acoustic vibration was recorded after annealing
Frequency drop from softening; whether new modes land on excitation orders
The annealing case shows why you can’t judge quality by damping alone. More damping, softer structure, more measured vibration. It depends on where the modes ended up.
Setup mistakes that produce numbers you shouldn’t trust
Most bad NVH data on lamination stacks is a fixturing problem.
Boundary conditions. A bare core, a core in a housing, and a core in a housing with end covers are three different structures. Winding varnish lowers the 0-order natural frequency; adding frame and end cover leaves 0-order nearly unchanged but raises other natural frequencies to varying degrees. Compare like with like or don’t compare.
Temperature. Stator core natural frequencies drop as temperature rises. A cold morning baseline and a hot afternoon retest will disagree, and the disagreement is real, not noise.
Method limits. Ultrasonic property measurement is tempting for its speed but has boundaries: shear modulus cannot be obtained by it, and using isotropic parameters produced roughly 4.5% error on the 2nd-order natural frequency. Also, accuracy depends strongly on lamination count and size — too few and accuracy is poor, too many and high damping causes the measurement to fail outright.
Mass loading. Accelerometers on a thin-walled core shift the frequencies you’re trying to record. Laser vibrometry avoids it. If you must use contact sensors, keep them identical across the whole comparison set.
Hammer tip and window. A soft tip that rolls off at 2 kHz cannot see slot-order content at 4 kHz. Match tip stiffness to the band you actually need.
A sequence that catches problems early
Sheet level — magnetostriction and coating condition. Insulation coating applied during sheet production puts the surface in tension in the rolling direction, and that beneficial tensile stress reduces magnetostrictive displacement. Coating damage is therefore an acoustic issue, not only an electrical one.
Post-join, bare core — modal test, both radial and axial excitation. Establish the reference table.
Excited core — AC excitation, listen and measure for buzz. Sweep clamping if you can; sensitivity to clamping is the tell.
Wound and assembled — repeat modal, then run-up order tracking.
Correlate — overlay order lines on the modal table. Coincidences are your action items.
Step 3 is the one worth doing on every new tool set and after every die maintenance interval. It’s fast and it catches drift before it reaches the winding line.
Sampling, not certainty
Full modal testing on every unit is not realistic in volume. What works is a split: 100% on cheap geometric measures (height, deviation, bow), sampled on modal, and a running control chart on the first three modes plus their damping ratios. Drift in a mean is more informative than any single measurement against a limit.
One more thing about the assembled-machine stage. If a spectrum shows sidebands or non-integer content, look at eccentricity before you blame the stack directly — although the two are related, since accumulated stacking error produces exactly the concentricity problems that create it. Eccentricity changes the air-gap distribution between rotor and stator, increasing certain electromagnetic force harmonics and potentially amplifying vibration.
FAQ
Can I predict motor noise from bare-core modal data alone? No, but you can rule things out. The modal table tells you where the structure will amplify. It says nothing about whether excitation exists at those frequencies. You need both halves.
Which single measurement gives the most value for the effort? Axial-direction modal testing on the bare core, with damping extracted. Radial testing is more common, and it misses the interlaminar behavior that most lamination-quality defects express through.
Is bonding always quieter than welding? Usually, at the machine level. Not because it changes modal frequencies much — bonding and welding have shown little effect on measured modal damping ratios — but because it changes how energy moves between sheets and into the housing. Judge it on the assembled machine, in an order-tracked run-up.
How do I separate magnetostriction from Maxwell forces in a measurement? Not cleanly, on an assembled machine. Characterize magnetostriction at sheet or ring-sample level under controlled flux density, then treat that as your excitation floor when interpreting core-level data.
Does low-magnetostriction steel guarantee a quiet core? It does not. Cores built with excellent-magnetostriction sheet often fail low-noise targets because of resonance between a core natural frequency and the magnetostrictive vibration. Material choice and modal placement are separate decisions.
What acceptance limit should I set for stack height deviation? Scale it to sheet thickness rather than fixing an absolute number. Average deviation below half a sheet thickness is a strong result; one full sheet thickness or more should fail.
Do I need an anechoic chamber? For absolute sound power, yes or close to it. For comparative work — before/after a process change — a consistent semi-reverberant room with fixed mic positions plus vibration channels will detect the difference. Just don’t publish the dB figure as absolute.
Lamination-related noise problems are rarely mysterious once you have the right two datasets side by side: a modal map of the stack and an order map of the running machine. Most programs collect one of them.
Partagez votre amour
Charlie
Cheney est un ingénieur d'application principal dévoué à Sino, avec une grande passion pour la fabrication de précision. Il est titulaire d'une formation en ingénierie mécanique et possède une vaste expérience pratique de la fabrication. Chez Sino, Cheney se concentre sur l'optimisation des processus de fabrication des piles de laminage et sur l'application de techniques innovantes pour obtenir des produits de haute qualité.
Brochure sur les nouveaux produits
Veuillez saisir votre adresse électronique ci-dessous et nous vous enverrons la dernière brochure !
Laissez les piles de pelliculage de Sino renforcer votre projet !
Pour accélérer votre projet, vous pouvez étiqueter les piles de laminage avec des détails tels que tolérance, matériel, finition de la surface, la nécessité ou non d'une isolation oxydée, quantitéet bien d'autres choses encore.



 French
  English
  German
  Spanish
  Italian
  Japanese
  Korean
  Dutch
Dutch  Indonesian