Let Sino's Lamination Stacks Empower Your Project!
To speed up your project, you can label Lamination Stacks with details such as tolerance, material, surface finish, whether or not oxidized insulation is required, quantity, and more.
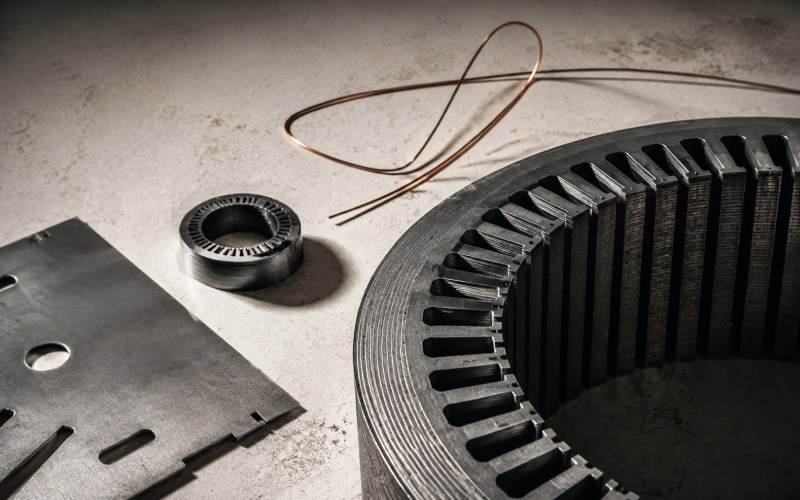
A material certificate tells you how an electrical steel sheet performed under controlled test conditions. It does not tell you how that material will behave after punching, stacking, interlocking, bonding, welding, or clamping.
That difference matters.
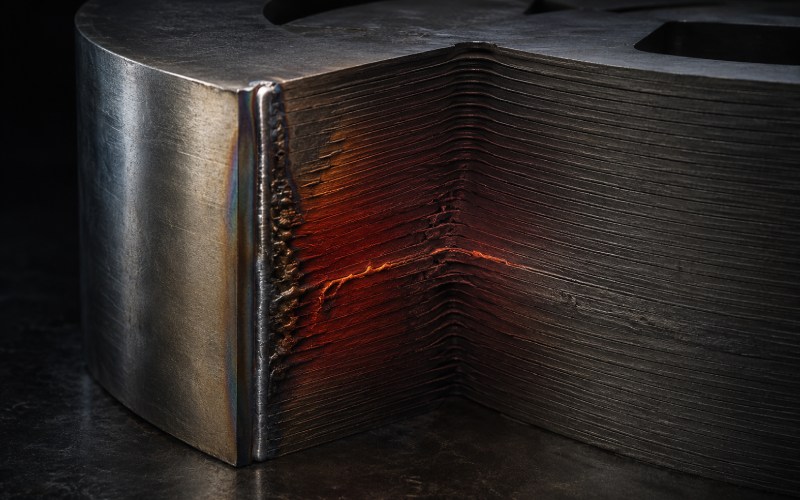
A qualified sheet can become a poor lamination stack. Cutting stress may reduce permeability. Burrs may connect neighboring layers. Welding can introduce heat, residual stress, and unintended current paths. The stack still looks correct. Dimensionally, it may also pass.
Magnetically, perhaps not.
No single measurement explains everything. The three results need to be read together.
Electrical steel is manufactured in thin, insulated sheets to restrict eddy-current circulation. Once those sheets enter production, their magnetic behavior can change.
Common causes include:
The effects do not always appear in the same way.
A burr-related short may cause a clear increase in AC core loss while the low-frequency magnetization curve changes only slightly. Mechanical stress may reduce permeability and raise exciting current, yet leave saturation flux density almost unchanged. A joint problem can make the complete core look worse than a ring specimen made from the same batch.
This is why lamination stack magnetic testing should separate material quality, manufacturing effects, and final assembly effects.
| Test | What it measures | What it can reveal | Essential test conditions |
|---|---|---|---|
| Permeability testing | Relationship between magnetic flux density and applied field | Cutting stress, air gaps, poor joints, direction errors, approach to saturation | Frequency, flux density, material direction, waveform, specimen geometry |
| Core loss testing | Energy dissipated as heat per cycle or per second | Burr shorts, coating damage, welding effects, dynamic loss, excessive eddy-current paths | Frequency, peak flux density, waveform, temperature, mass |
| B-H loop testing | Full magnetic response during one excitation cycle | Coercivity, remanence, permeability, loop area, saturation, asymmetry | Excitation history, frequency, waveform, phase correction, temperature |
| Exciting current testing | Current needed to establish the required flux | High reluctance, local gaps, stress, poor joints, saturation | Frequency, peak flux density, winding configuration |
| Stacking factor measurement | Magnetic material volume relative to total stack volume | Excess coating, gaps, waviness, thickness variation | Stack height, mass, density, sheet dimensions |
The measurements overlap. They do not replace one another.
Core loss tells you how much energy is being dissipated. Permeability shows how hard the stack must be driven. The B-H loop connects those observations and often indicates where to investigate next.
For a simple linear material:
mu = B / H
where:
Electrical steel is not linear. Its permeability changes with flux density, frequency, material direction, stress, temperature, and magnetic history. Reporting one permeability value without those conditions is not enough.
mu_r = mu / mu_0
This compares the material with free space.
mu_a = B_peak / H_peak
This is commonly useful for AC operation. The result must include the test frequency and peak flux density.
mu_d = dB / dH
This represents the local slope of the magnetization curve. It changes across the curve and drops as the material approaches saturation.
Incremental permeability is obtained from a small magnetic excursion around a DC operating point. It is relevant when a magnetic core carries AC ripple together with DC bias.
A sheet specimen can be used to study the material itself. A finished lamination stack includes joints, air gaps, fasteners, clamping stress, and geometry.
The value obtained from a finished core is therefore often an effective permeability of the complete magnetic circuit. It should not be presented as the intrinsic permeability of the electrical steel.
That wording prevents misleading comparisons.
When the magnetic state of a lamination stack repeatedly reverses, some input energy becomes heat. The energy loss per unit volume during one complete cycle is represented by the area inside the B-H loop.
Volumetric power loss can be written as:
P_v = f * integral(H dB)
where:
Specific core loss is normally reported in W/kg:
P_s = P_v / rho
where rho is material density.
Core loss is commonly considered as a combination of:
P_core = P_h + P_e + P_ex
where:
These components are useful for analysis, but they should not be treated as three directly measured values. Separating them requires measurements across suitable frequencies and flux-density levels, followed by a stated loss model.
For production quality control, total loss at the intended operating point is often the more reliable acceptance metric.
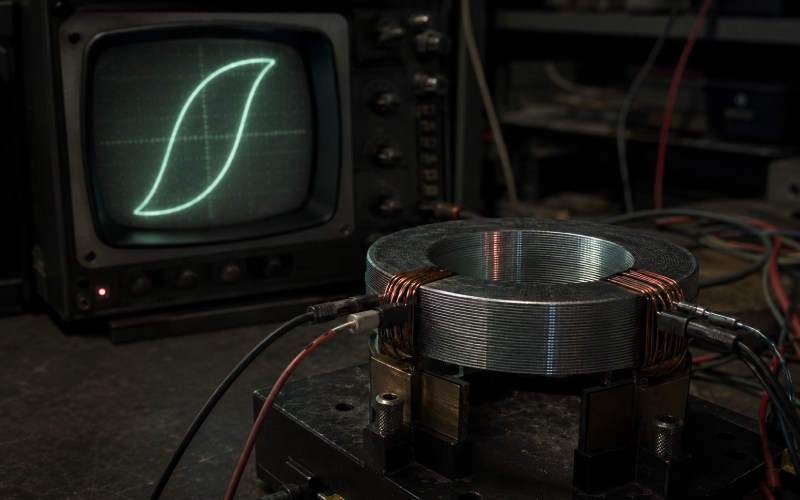
Flux density is calculated from the induced voltage in the sensing winding:
B(t) = [1 / (N_2 A_e)] integral(v_2(t) dt)
where:
A sinusoidal induced voltage produces an approximately sinusoidal flux-density waveform. The exciting current does not have to remain sinusoidal. Near saturation, it often becomes sharply distorted.
This distinction is easily missed.
Two laboratories can test the same lamination stack at the same frequency and nominal flux density, yet report different losses if one controls current waveform and the other controls induced-voltage waveform.
Every report should state what was controlled.
A B-H loop should be treated as measurement data, not just a visual curve.
The coercive field, H_c, is the reverse field required to bring B back to zero.
An increase in coercive field can indicate that magnetic domain movement has become more difficult. Cutting stress, plastic deformation, residual stress, and heat-affected regions are possible causes.
Remanent flux density, B_r, is the flux density remaining when the applied field returns to zero.
It depends on the material, maximum excitation, magnetic history, and whether the specimen reached a stable cyclic condition.
The enclosed area represents energy loss per unit volume per cycle. At the same peak flux density and frequency, a larger loop area means greater magnetic energy loss.
The slope is related to permeability. A reduced slope can point toward stress damage, poor joints, unintended air gaps, or incorrect material orientation.
Near saturation, a large increase in H produces only a small increase in B. The exciting current then rises quickly.
Testing only at low flux density can hide this behavior. Testing only near saturation can hide low-field permeability damage. Several operating points are better.
A shifted or asymmetric loop may come from:
Reverse the specimen or measurement connections and repeat the test. If the asymmetry moves with the measurement system, the material may not be the problem.
Use strip or single-sheet specimens to verify the base electrical steel.
This level is suitable for:
It does not reproduce the final production process.
A processed witness specimen should use the same:
Ring-shaped witness stacks are useful because they provide a largely closed magnetic path. They help isolate manufacturing damage without the complicated joints of a complete component.
Test the complete stator stack, rotor stack, transformer core, or assembled magnetic component when final geometry affects performance.
Finished-core testing captures:
A practical verification chain is:
Incoming sheet -> Processed witness stack -> Finished core
The point at which performance changes helps locate the process responsible.
| Test result | Possible cause | Recommended check |
|---|---|---|
| Core loss rises, permeability changes little | Burr bridges, coating damage, interlaminar shorts | Inspect burr orientation, layer resistance, welding, and edge contact |
| Permeability falls and exciting current rises | Residual stress, clamping stress, air gaps, poor joints | Compare before and after assembly; reduce fixture or clamping pressure |
| Coercive field increases after punching | Cutting stress or plastic deformation | Test different tool clearances and edge-to-area ratios |
| Loss increases mainly at higher frequency | Eddy-current paths or dynamic loss | Check insulation damage and test across several frequencies |
| Loss rises after welding | Heat, residual stress, conductive bridges | Compare weld count, position, length, and heat input |
| Loop becomes asymmetric | DC offset, sensor error, residual magnetization | Reverse wiring or specimen and repeat |
| Finished core fails while witness ring passes | Assembly geometry, joint gap, press fit, or clamping | Inspect the complete magnetic path and assembly stress |
| Results vary after reinstalling the sample | Fixture pressure or positioning sensitivity | Define fixture torque, alignment, and installation procedure |
This table is a diagnostic starting point, not proof of root cause. Confirm the suspected mechanism with a controlled comparison.
A small phase error between current and voltage channels can create a large error in measured loss, especially when the true magnetic loss is small relative to the apparent power.
Other common errors include:
A smooth-looking B-H loop does not prove that the measurement is accurate. Calibration, channel deskew, reference specimens, and repeatability checks still matter.
A useful specification should define more than a maximum W/kg value.
Include:
Manufacturing degradation can be tracked with:
Loss increase (%) = [(P_processed – P_sheet) / P_sheet] * 100
This percentage should be used together with an absolute loss limit. A small percentage increase is not acceptable if the starting material already sits near the design limit.
For a meaningful engineering review or quotation, provide:
These details allow the manufacturing and magnetic requirements to be reviewed together. A low-cost stacking method may not remain low-cost if it creates higher loss, heat, noise, or exciting current in the finished product.
Use sheet testing for incoming material, a processed ring or witness stack for manufacturing control, and finished-core testing for assembly effects. The right method depends on whether you need to evaluate the material, the production process, or the complete component.
The certificate normally represents controlled sheet specimens. A finished stack includes cutting stress, burrs, coating damage, welding, interlocking, clamping, joints, and dimensional variation. Any of these can increase measured loss.
Yes. Amplitude, differential, and incremental permeability can be derived from suitable B–H data. The selected definition, frequency, flux density, and magnetic operating point must be reported.
Not every visible burr creates a measurable loss increase. The larger risk is a burr or damaged coating that forms a conductive path across several layers. Contact pressure, burr direction, and joining method affect the result.
Punching can create plastic deformation and residual stress near the cut edge. This may reduce permeability, increase coercive field, raise exciting current, and increase core loss. The effect becomes more noticeable when the component has a high cut-edge-to-area ratio.
It can. Welding may add residual stress, create heat-affected regions, damage insulation, and electrically connect layers. The result depends on weld position, number, length, heat input, and stack geometry.
It is useful as a baseline, but it does not represent all losses created by inverter harmonics. Testing should include representative frequencies and waveforms when high-frequency excitation contributes meaningfully to heating.
Use watts per kilogram for material and process comparison. Use total watts when evaluating the heat generated by the complete core. For finished lamination stacks, reporting both is often useful.
Use enough points to cover the expected operating range and the approach to saturation. A single low-field point can miss saturation behavior. A single high-field point can hide low-field permeability degradation.
Lamination stack magnetic testing should prove more than whether the electrical steel was acceptable when it arrived.
It should show what happened after cutting. After stacking. After joining and final assembly.
Permeability testing measures how readily the stack carries flux. Core loss testing measures the energy converted into heat. The B–H loop shows how the magnetic state changes through the entire cycle.
Read together, these measurements can separate a material problem from a manufacturing problem—and a manufacturing problem from an assembly problem.
If you are developing a custom lamination stack, prepare the material grade, sheet thickness, stack drawing, operating frequency, target flux density, joining method, and required inspection level before requesting a technical review. That information makes it possible to evaluate manufacturability and magnetic performance as one engineering problem.



 English
  German
  Spanish
  French
  Italian